
7+ Custom Google Analytics Dashboard Reports (Examples & Guide)
Google Analytics is #1 tool you need to know if you own a website. We've put together everything you need to know about building your custom Google Analytics Dashboard Reports.

Do you know that Google Analytics is used by 55.49 % of all websites? This means approximately 28.1 million websites use Google Analytics! This huge popularity of the Google Analytics tool is because of its ability to provide valuable insights about a website. Google Analytics provides you access to a lot of custom Google Analytics Dashboard Reports that you can leverage to monitor different aspects of your website. In addition to this, you can also create custom automated reports on third-party apps like Stackby using column-linked API connectors.
But why care about creating a custom Google Analytics dashboard or report?
- Custom reports are incredibly useful to monitor specific website metrics especially when you have a big team and each one wants to track a different set of metrics.
- Google analytics reports help you understand what’s working for your website and audience and what needs a little tweaking.
- It helps you understand from where the traffic is coming onto your website such as organic channels, paid channels, etc.
- It also helps you understand whether your target audience is interacting with your website as expected or not, what pages are being viewed the most, how long are they spending on pages, what makes them leave your site, and so on.
To create a Google Analytics report, you can either import a template from the Stackby gallery or create one from scratch. There are a lot of great custom templates that have been submitted by agencies and users on Google Analytics that you can directly use for reporting.
Today, we will showcase 7 Google Analytics dashboard examples and show the exact steps you can use to create them. We’ve also included a mini-guide later in the article that will help you create templates from scratch.
7 Google Analytics Dashboard Examples
1. Device Report
Today, around 5 billion people use the internet. Out of these, 92.4 percent use a mobile phone to go online at least some of the time, and mobile phones now account for more than half of our online time, and more than half of the world’s web traffic. It’s clear that mobile users are increasing and depending on the type of your business this number can be high or low. Hence, it’s very important to track the device split for your website and this report helps you exactly do that. If the number of mobile users is high you should focus on creating a good mobile experience for your website users.

Here’s how you can create this dashboard using Google Analytics custom reports:
1. On your GA dashboard, click on custom reports.
2. Then click on the “Create a custom report” button
3. After giving a name to your report, under metrics, choose “sessions, bounce rate, and average page on time” and under dimensions choose “device category”
4. That’s it. You’re done. Just save the template. Remember you can always access the report under “Saved reports”. Above is a snapshot of the report we created using the same steps.
2. Browser report
One of the most common ways to lose online sales is because of your website’s incompatibility with certain browsers. Hence, if you run an e-commerce website you should track a report that shows your conversions for every browser. This browser report is the best Google Analytics dashboard that will exactly show you the anomalies in your conversions for a particular browser.
For example, if Safari and Chrome are converting well but Internet Explorer has significantly lesser conversions, that’s a red flag. This is a good sign to further investigate the problem at hand and fix it.

Here’s how you can create this report on Google Analytics.
1. Go to your GA dashboard and then click on Custom Reports (under Customization).
2. Then click on the “Create a new custom report” button.
3. After giving a name to your report, under metrics choose “sessions, conversion goals, and bounce rate” and under dimensions choose “Browser”. You can also add Browser size and Version to the report.
4. That’s it. You’re done. Just save the template to use it further. If you ever feel the need to add more metrics you can do that by clicking on the Edit report button.
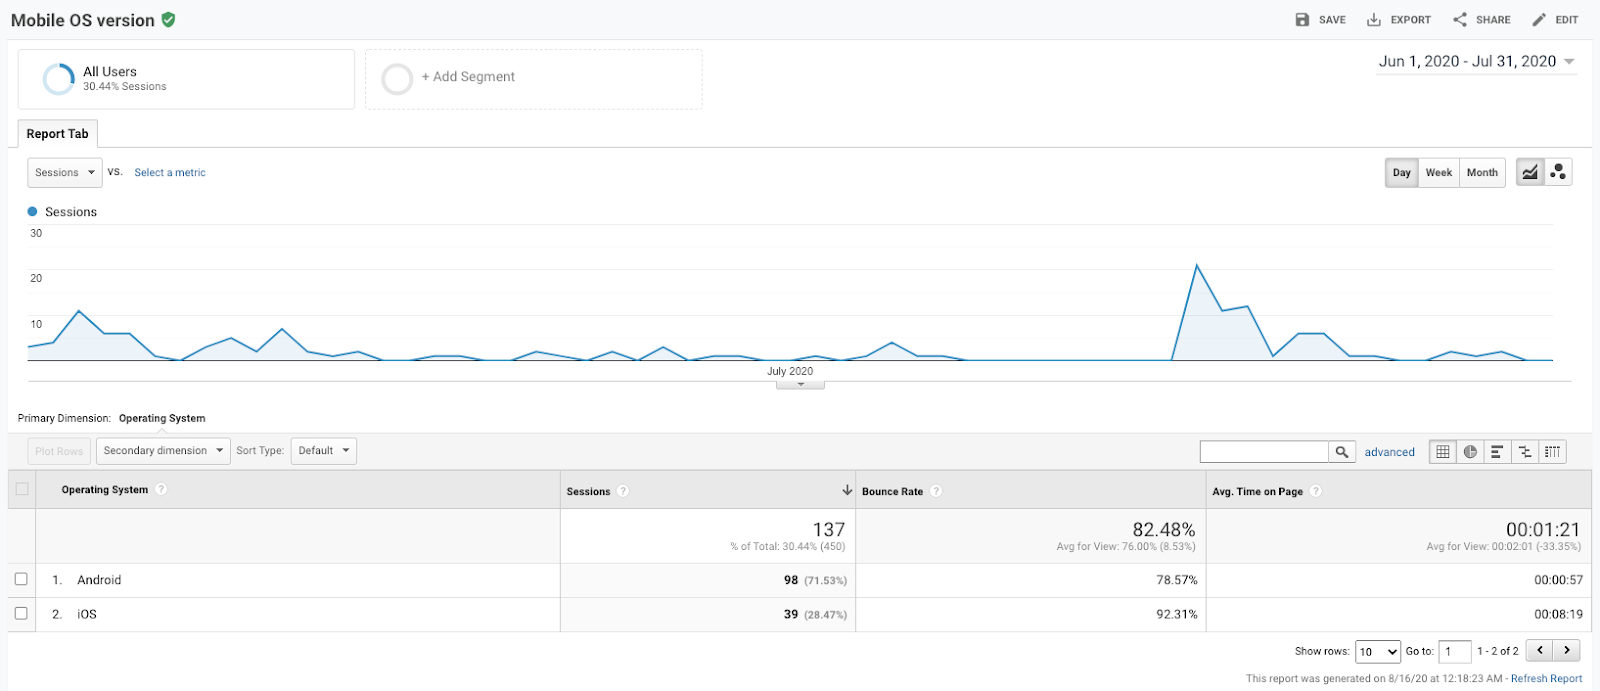
3. Mobile Performance Report
If most of your traffic is through mobile, it is a great idea to track the performance of your website in platforms namely, iOS and Android. For example, if you see a high bounce rate for one of your pages on Android, you need to find the issue and fix it. This helps you create a good web experience which is crucial for growth and returning visitors.
Here’s how you can create this custom Google Analytics dashboard/report -
1. Go to your GA dashboard and then click on Custom Reports (under the Customization tab).
2. Then click on the “Create a new custom report” button.
3. After giving a name to your report, under metrics choose “sessions, bounce rate, and average page on time” and under dimensions choose “Operating System”.
4. Under Filters add “Device Category” exactly as mobile (as you don’t want any information from desktop users)5. That’s it. You’re done. Just save the template. Remember if you ever wished to add more parameters you can do that by clicking on the “edit the template” button.
4. Monthly Dashboard
To ensure you are effectively tracking your website’s performance you should create a monthly dashboard. This allows you to compare metrics every month and see your progress. Few metrics that you should track are conversions, users, sessions, traffic sources, and more.
To help you create the dashboard I’m using Stackby which is a SaaS platform that helps non-technical folks make the most of spreadsheets. The best part about it is that you can straight off use pre-made templates and connect it with GA (Universal Analytics) or GA4 APIs to generate the reports. Here are the steps you can follow:
1. First register for a trial account at Stackby.
2. The next step is to copy the custom dashboard from the template page. To do that just click on “Copy Stack” and select a workspace.
3. The next step is to connect your GA account with Stackby. Just head to the integrations page and click on “Add your API key”. After authentication, you just need to give a name to the API key.
4. The next step is to update the View ID which you can get from the view settings page on Google Analytics and call the pre-built API functions in Stackby.
Pre-built API functions available in Stackby - Users, Traffic, Sessions, and PageViews, Goal Conversion, Lifetime value and cohorts data, Google Adwords data. Google Ecommerce quantity data, etc.
That’s it! You’ve created a custom Google Analytics dashboard.
The best part is that the dashboard gets updated with a single click. To learn the exact steps to create the dashboard, you can follow the tutorial video we created.
5. Social Traffic Analysis
Social media is critical to creating brand awareness for your product/platform. Even when there are hundreds of social media channels out there, only a few will actually create business impact. To ensure you’re finding the right platforms and making the best use of it, you need to track your social media traffic. This is the best Google Analytics dashboard example when it comes to social traffic analysis.

Let us see how you can create a social media traffic Google Analytics report:
1. Go to your GA dashboard and then click on Custom Reports (under the Customization tab).
2. Then click on the “Create a new custom report” button.
3. After giving a name to your report, under metrics choose “sessions, bounce rate, goals, events and average page on time” and under dimensions choose “Social Media Network”.
4. That’s it. You’re done. Just save the template.
In addition to this report, we recommend you create campaign URLs for your social media campaigns to accurately understand the impact of different social media channels.
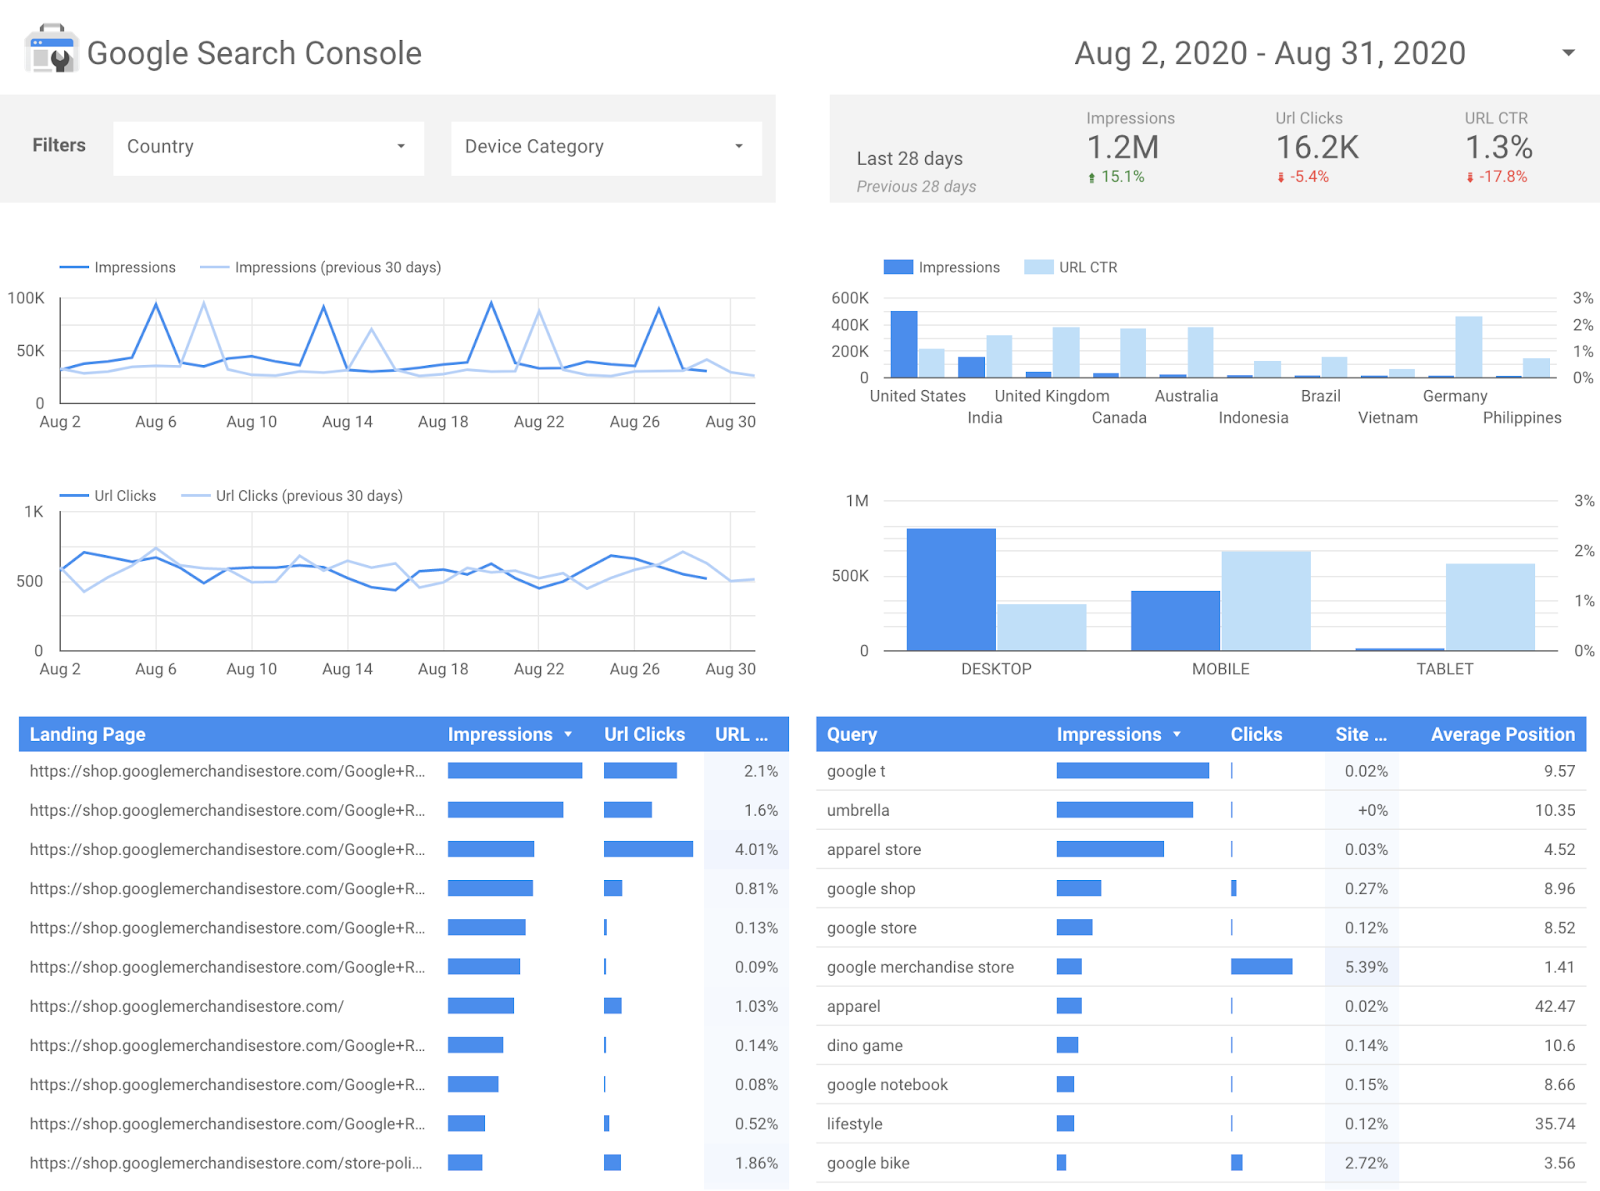
6. Organic Search Referring Report
This custom Google Analytics dashboard report will help you understand the organic source (including search engines, landing pages, keywords, and more) of your traffic. This will help you understand the exact source of your organic traffic.

Additionally you can use it to understand which source works to drive you more revenue and which one needs optimization. Here’s how you can create the report using Google Analytics:
1. Go to your GA dashboard and then click on Custom Reports (under the Customization tab).
2. Then click on the “Create a new custom report” button
3. After giving a name to your report, under metrics choose “sessions, bounce rate, %new sessions, revenue, avg. session duration, per session value” and under dimensions choose “source and referral path”.
4. In addition to this feel free to customize reports according to your needs.
5. That’s it. You’re done. Just save the template.
7. Paid vs Organic search report
Measurement is critical, both for defining success and optimizing towards it. If you’re running paid ads (Google Adwords or social media advertising) it is very important to understand the performance when compared to organic traffic. Ideally paid traffic should be lower when compared to organic traffic but this solely depends on the type of business. This is the best Google Analytics dashboard report that allows you to compare the behavior of a paid user when compared to an organic user. To use it you can directly import the template from here.
How to Create Custom Google Analytics Dashboards?
There are some incredibly useful templates that we’ve shared above. But what if you want to create a completely different report? We’ll be covering three popular ways of creating custom reports:
1. Google Analytics
2. Stackby
3. Google DataStudio
1. Google Analytics
The easiest way to create custom reports is by using Google Analytics. Here are the steps you need to follow - 1. Under the customization tab, click on custom reports. 2. Then click on the “New Custom Report” button. 3. After naming the report, you’ll need to select some key parameters.

Type - If you want the report to be viewed differently from the standard view, you can choose the other views - Flat Table, Map Overlay, etc.
Metrics Group - Here you need to choose the metrics you want to track. For example - sessions, new sessions, and more.
Dimension - Here you can decide the source and other parameters you want your report to be based upon.
Filter - If you want to remove certain metrics you can use the filter option.
Views - Here you can select the website property you want to create the report for. 4. Then just click on the Save button to see the report in action. You can always customize a report later by editing.
Note - If you’re too lazy to create a report, you can always import a premade template contributed by the users. One major downside of creating a report on Google Analytics is that you can only work with metrics measured by GA and you can import a metric from any other tools such as Google Sheets or Google Search Console.
2. Stackby
Stackby is another great platform to create custom Google Analytics Dashboards or Google Analytics reports. You just need to connect your GA account with Stackby to get started.

Here’s how you can go about creating a custom Google Analytics report:
1. The first step is to create a free account on Stackby.
2. The second step is to integrate GA with your Stackby account. You can follow the detailed steps here to do that.
3. After integrations, you need to create a stack and select column type to connect to an API or a service.
4. Add your View ID (from your Google Analytics account), add date ranges, and call the different pre-built API functions like Users, Sessions, Goal Conversions, E-commerce data, traffic, etc. in the columns to bring data automatically to your tables and then refresh cells to bring real-time data.
The main benefit of using Stackby is the ability to create custom hybrid dashboards by leveraging other popular marketing API integrations like Google Search Console, Ahrefs, Serpstat, YouTube, and more, in the same table to cross-leverage data across platforms
3. Google DataStudio
Another way to create custom reports or google analytics dashboards is by using Google DataStudio. The best part about DataStudio is that it allows you to add third-party data sources.
1. To get started you can either use a pre-made dashboard or create a custom Google analytics dashboard.
2. To create a custom dashboard, click on “Blank Report”.
3. The next step is to connect data sources. In addition to GA, you can add Google Ads, Sheets, YouTube, and other third-party integration.
4. After authorization of the sources, you can add them in your report. You’ll see metrics and style suggestions on the right-hand side.
5. You’re free to resize and use different elements in the same space. If you need to create multiple dashboards you can also add an additional page.
 Rachit Khator
Conclusion
Hope you enjoyed the custom Google Analytics dashboard examples we’ve listed above. This will clearly help you effectively track different metrics for your website properties. Depending upon your requirements you can choose the platform of your choice. If you’re looking to create hybrid and automated google analytics dashboards you can use Stackby. There are over 2000+ apps you can connect to Stackby.
Take a free trial and see it for yourself.
Frequently Asked Questions
1. What are the types of dashboards available in Google Analytics?
There are more than 10 custom Google Analytics dashboards that you can use including executive dashboard, content marketing dashboard, social media dashboard, mobile dashboard, social traffic analysis dashboard, monthly dashboard, etc.
2. Can you automate reports from Google Analytics?
Yes, you can use Google Analytics Data API (GA4) to create reports and understand how people use your website. You can integrate this API with applications like Stackby and build customer Google Analytics dashboards and reports. You can also automate complex tasks to save time. To know more watch this video on how to create a custom Google Analytics dashboard.
3. What do Google Analytics reports include?
A Google Analytics report can include sessions and users data, traffic data, goal conversion data, and other important metrics. Use Stackby’s pre-built Google Analytics Reporting template for free to get started with creating automated, customized Google Analytics reports.
![A Simple Guide on Workflow Management Software [Updated 2024]](/blog/content/images/size/w960/2021/12/work-management-blog.png)