
How to Automate Youtube Analytics Reporting
Here’s a step-by-step process to automate YouTube reporting with Stackby and achieve better results.

If you are looking for ways to automate YouTube reporting, this blog is for you. YouTube analytics reporting brings all the important YouTube metrics in one place and helps you make better decisions. Did you know that YouTube celebrated its 15th anniversary in 2020? Yes, it’s been around for so long, yet many of us have been ignoring its potential.
- YouTube has a diverse user base with almost 2.5 billion monthly active users!
- 15.6% of YouTube’s traffic comes from the United States
- YouTube is the second largest search engine in the world
- 70% of people have bought a product after seeing it in a YouTube ad
This gives us a reason to bring a tool that can automate YouTube reporting for marketers, making it much easier for them to understand their channel performance.
Why is YouTube Analytics critical for success?
It can sometimes be a challenge to understand the performance of your content on YouTube. If you are someone who wants to grow and optimize their YouTube channel. If you want to understand your audience better. If you want to get insights about your YouTube watch time, subscribers, and playback locations. All you have to do is create a process for automatic report generation for YouTube and Stackby can help you with that!
YouTube analytics is critical for your business’s success because:
- It gives you more in-depth knowledge about the behavior of your audience
- It helps you make the most of your investments in YouTube marketing by making it easier for you to analyze YouTube trends
In all, it gives you the ability to harness the power of your YouTube data which takes us to our next point of discussion.
Which YouTube Analytics Data you can Track?
Every YouTube channel has certain metrics (quantifiable values) related to it that help marketers analyze how the channel is performing. As a result, you can understand which content is being appreciated by your target audience and which is not. You can readily optimize your YouTube videos and make things work in your favor.
Examples of YouTube metrics that can be tracked by automating YouTube reporting:
- YouTube Channel Metrics - They help you understand the overall performance of your YouTube channels such as subscribers, real-time views, top videos, channel views, and channel watch time.
- YouTube Reach Metrics - They help you understand how people discover your videos. They include metrics like impressions, CTR (click-through rate), and traffic sources.
- YouTube Engagement Metrics - They help you understand how users interact with your channel. They include metrics like average view duration, top playlists, and card and screen reports.
- YouTube Video Analytics - These include metrics such as views, video subscribers, watch time, average view duration, etc. These metrics apply to specific videos.
- YouTube Revenue Metrics - These metrics include estimated revenue, transaction revenue, estimated ad revenue, etc. They can be tracked if your channel is eligible for YouTube monetization.
- YouTube Audience Metrics - They help in understanding who watches your videos and give you insights about your YouTube content strategy. These metrics are unique viewers, returning viewers, watch time from subscribers and audience demographics.
Why automate YouTube analytics reporting?
Automating YouTube reporting with Stackby helps you in a plethora of ways such as:
-- Automatically collect YouTube performance data for all your KPIs
All you have to do is connect your YouTube channel account to Stackby using the API key. Once connected Stackby will pull all the required data from your YouTube channel account and present it to you in an easy-to-understand and visualize format. You can fetch data in real-time and understand how your YouTube channel is performing at the moment.
-- Maximize the impact of your YouTube content with valuable insights
If you are presenting this report to stakeholders or to your clients who have no idea which YouTube metrics are important and why this report can be a blessing in disguise. It will showcase only the relevant metrics that are important for your clients/ stakeholders so that they can understand how the channel is performing and what changes are required.
-- Get a comprehensive YouTube overview with cross-channel reports
If you want to create separate reports for every YouTube channel your business owns or whether you need only one compact report, Stackby allows you everything. With Stackby, you can track the important KPIs related to all your YouTube channels in one place and create a comprehensive YouTube overview of your business.
How to automate YouTube analytics reporting?
Now comes the time to understand how to automate YouTube reporting using Stackby. Here’s a step-by-step process for you.
1. Connect to YouTube Analytics API
YouTube's automatic report generation process begins with connecting Stackby to YouTube analytics. You can bring channel analytics and video analytics both using the following process.
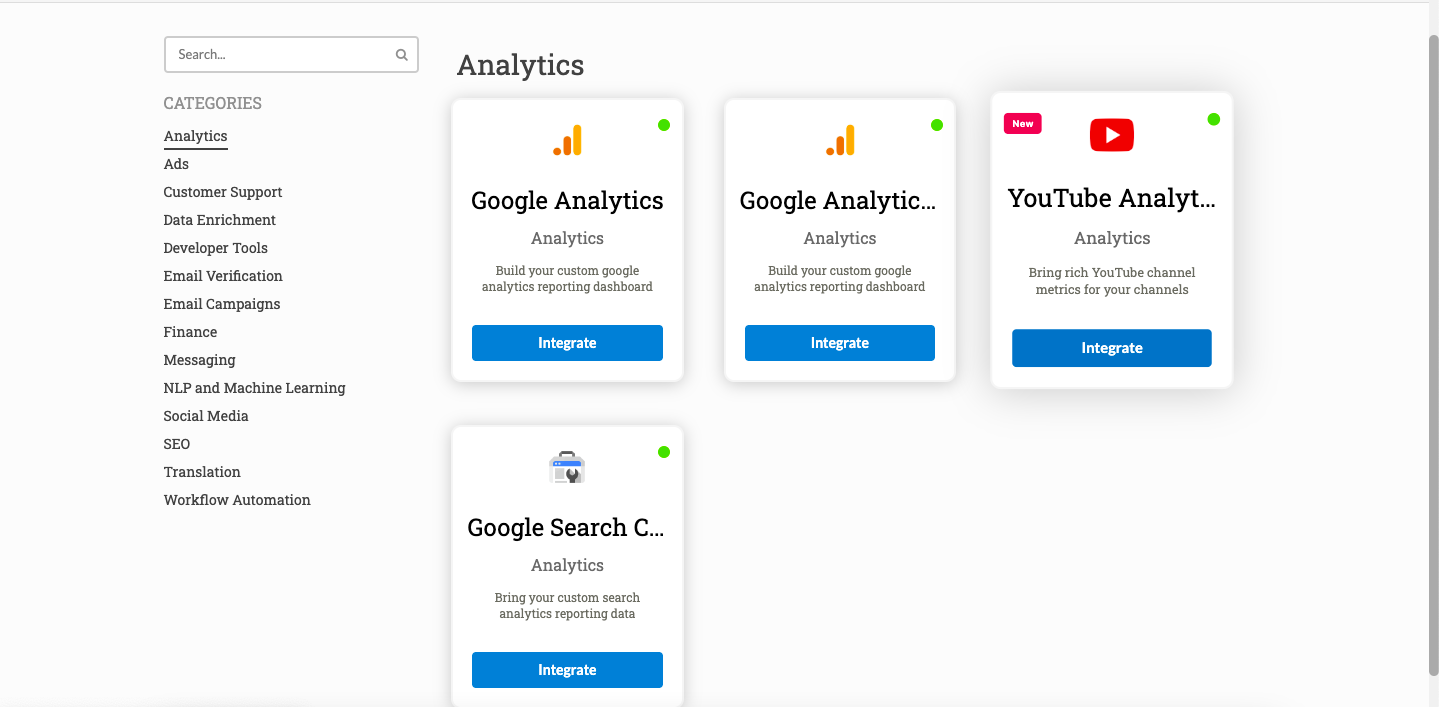
To do so, go to Stackby Integrations -> Click Analytics -> Click YouTube Analytics (for channel data)-> Add API key -> Name your connection -> Save
Note: If you want to bring individual video analytics, you can connect to Stackby Integrations → Social Media → YouTube and then connect your account.
Easy isn’t it? You have now linked YouTube analytics with Stackby and have authorized Stackby to pull data from your analytics account.
2. Create a Stack
Now, you have to create a YouTube Channel reporting Stack. If you do not want to start from scratch try our predefined YouTube Channel Analytics template. This template will help you get started with automated YouTube reporting in just a few minutes. But, to explain the process in detail, let us see how to proceed if you are creating a YouTube analytics report from scratch.
3. Add channel IDs (or video IDs)
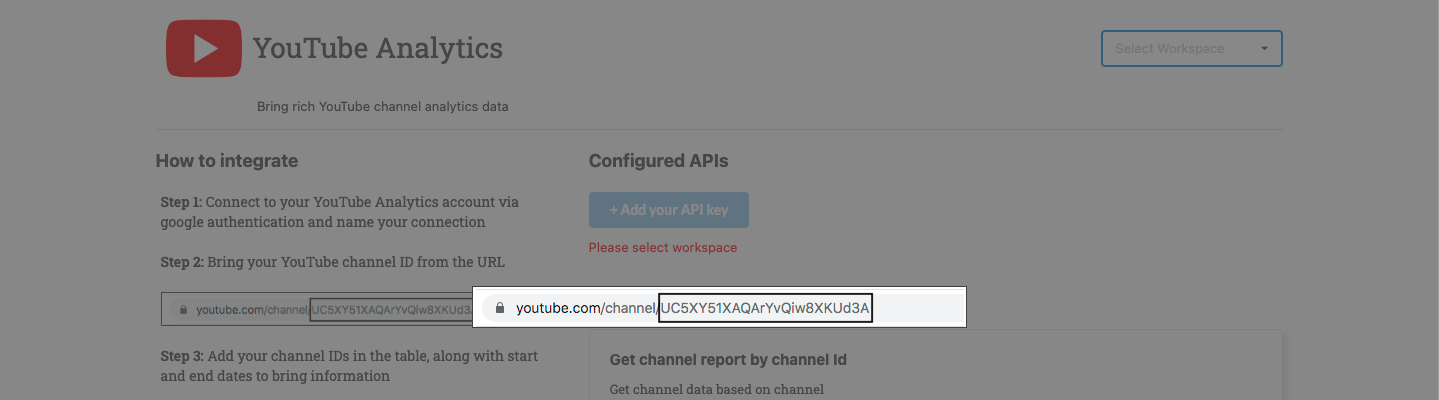
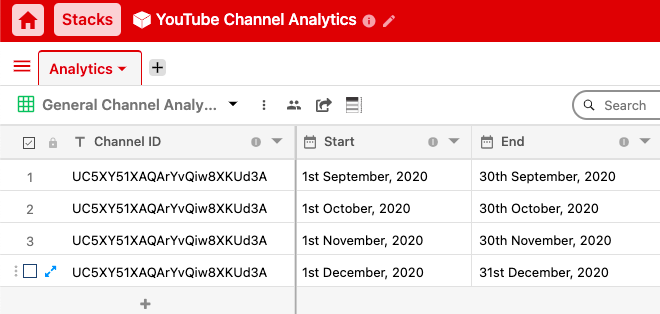
Copy the channel IDs (or individual video IDs) from your YouTube channels and paste them into the YouTube Channel reporting stack that you have created. If you are using our template, add the channel IDs in the respective column of the template.
4. Add start and end dates
Now you have to set the start and end dates for the period you want to track the performance of your YouTube channels. So, this way you can create weekly, bi-weekly, quarterly, or monthly YouTube analytics reports.
5. Connect to API column
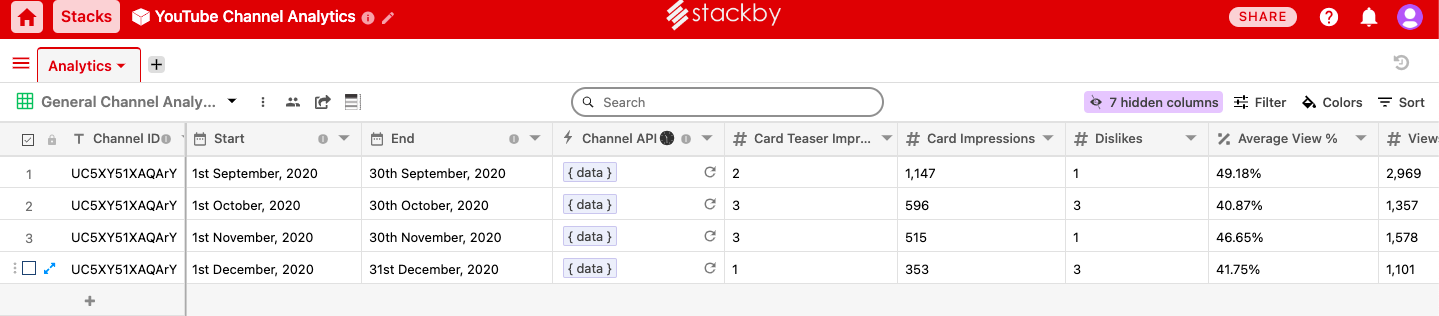
Create an API column for YouTube Analytics. Select the API key and the service that you want to access. In this case, it would be to get a channel report by channel id. Select the reference column which is the Channel ID column and select the start date and end date columns for reference. This will help you in fetching data based on the given start and end dates for every channel ID mentioned in the channel ID column.
For bringing video analytics, choose YouTube in the API column
select the reference column as video ID and use the video statistics API function to bring data for individual videos.

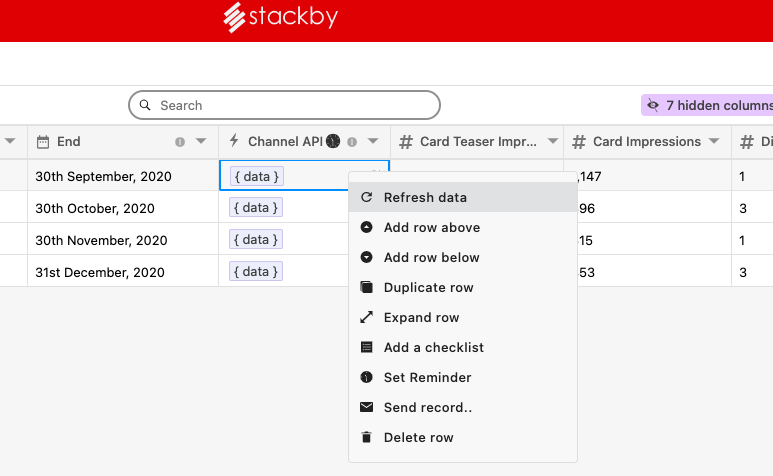
Note: For real-time information, just refresh the data by right-clicking on the data icon for the respective rows. You can also select multiple rows and refresh their data simultaneously.
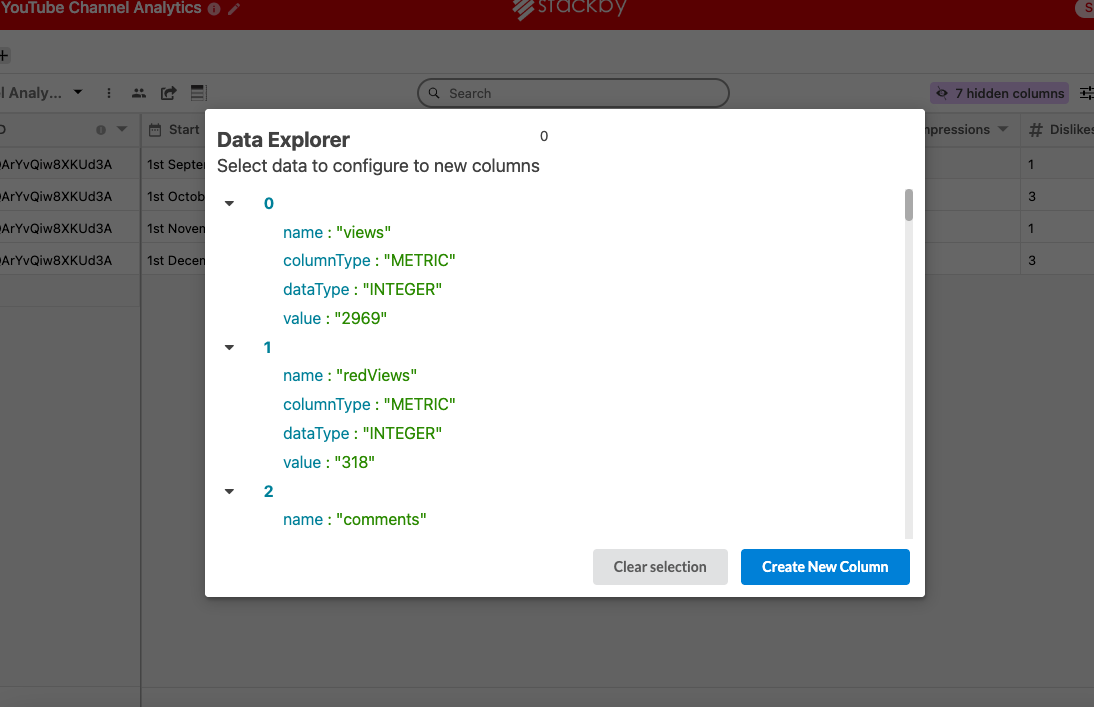
6. Use the data explorer to add data to your report
Now, to help you visualize the data in a better way, Stackby provides an in-built JSON data explorer. Just click on the {data} icon that appears in the API column as soon as you connect your Stack with an API. This will open a JSON data explorer where you can see all the data that has been fetched from your YouTube channel. Just select the data that you want to showcase in your report and click on ‘create new column’. This will create separate columns for the selected data so that you can track and monitor them easily.
7. Create different views to visualize data
You can now create separate views to filter out data based on your requirements. For instance, you can create a different view for YouTube engagement metrics and a separate view for YouTube video analytics. This way you can share different reports that are easy to understand and access.
Different data views for YouTube channel reporting:
- General report: In this view, you can present general data about your channels like total minutes watched, views, likes, dislikes, comments, shares, and more.
- Subscribers: In this view, you can present how many subscribers you have gained or lost in the time period mentioned in the start and end dates columns. So if you are primarily working to increase the number of subscribers this view will keep your YouTube reporting sorted.
- View durations: This view will help you analyze how long the audience is watching your channels or in other words, how content is performing on YouTube. It can include metrics like total minutes, average view duration, minutes watched, average view percentage, and so on.
- Cards: This view can help you understand how your cards and teasers are performing on YouTube. You can keep track of card impressions, card clicks, card teaser impressions, and card teaser click with this view.
- Videos in Playlists: Here’s another view that you can create that will tell you how many videos have been added/removed to/from playlists.
These are just a few examples of how you can create a comprehensive YouTube analytics report for your channels and monitor the data closely. You can create more such views based on your business requirements or YouTube goals.
8. Automatic report generation
As promised, we are now going to tell you how you can automate YouTube reporting and create real-time reports so that you can make decisions accordingly. Go to your API column and click on the clock icon. It will allow you to schedule and automate your API column. Select the day and time when you want to refresh the data automatically. Schedule the automation and just sit back and relax while Stackby will do the work and provide you with real-time YouTube reporting.

Start with automatic YouTube reporting today!
YouTube analytics report can be a game changer in your success strategy. YouTube insights can help you understand whether you need to change your content strategy and create videos that your audience wants to watch or it can help you optimize your YouTube marketing strategy for better results.
To know more about how to create automated YouTube channel reporting step by step, watch the following video.
If you have not signed up for Stackby yet, join us for free and start automating your workflows in just a few clicks.
Frequently Asked Questions
1. How do I get my YouTube analytics report?
Creating a YouTube analytics report with Stackby is easy. Connect your YouTube channel with Stackby using an API key. Create a stack to store all the required data. Connect a column of the stack with API and bring in the YouTube analytics data based on channel IDs and video IDs. This way you can create your own real-time YouTube analytics report on a table in a few minutes.
2. What is the YouTube Analytics API?
YouTube Analytics API helps you create custom reports that include YouTube Analytics data. The API provides filtering and sorting options and allows you to retrieve data for YouTube Analytics.
3. Which template can be used for YouTube reporting?
Stackby provides YouTube Channel Analytics and YouTube Channel Metrics templates that help you track the most important data related to your YouTube channels. You can use these templates for free and create your own YouTube reports. Stackby also provides a YouTube Video Production and Tracking template where you can bring video data and record the details of all videos in one place.
![A Simple Guide on Workflow Management Software [Updated 2024]](/blog/content/images/size/w960/2021/12/work-management-blog.png)