
How to Automatically Pull Data in your tables using API Connectors in Stackby
Are you still stuck with spreadsheets? The world is moving forward with real-time reporting tools for enhanced productivity and decision-making.

“Joshua works as an SEO manager and often needs accurate data for making good decisions regarding the optimization of the business website. Earlier, achieving data accuracy was not possible since data reporting was done manually via copy-pasting on spreadsheets. Joshua took weeks to generate reports. Now, thanks to automation, Joshua can create real-time reports and share precise data with his team to ensure accurate decision-making.”
Want to be like Joshua? Read on! This post gives you a complete guide on how to pull data and create real-time reports in Stackby using native API connectors to popular services.
Let’s start with some basics.
- What is real-time reporting?
- Benefits of real-time reporting in your workflows
- How to automatically pull data using API connectors for real-time reporting?
- Use-cases for real-time reporting in Stackby
What is real-time reporting?
Simply put, real-time reporting is the state of your business right now. It enables you to get the latest results possible and a current snapshot of your business’ performance. Real-time reports can be used by accountants, finance experts, product managers, marketers, entrepreneurs, sales teams, and other stakeholders in an organization.
Real-time reports can be accessed at any time from anywhere and are based on the latest data and are much more effective than static reports. Static reports, also known as batch reports, are the ones that are based on data available up to a particular time. Let’s see some important benefits of real-time reporting.
Benefits of real-time reporting in your workflows
1. Minimal manual work: No more selecting data from a third-party app and updating spreadsheets manually. With automation, you can create fetch data automatically in Stackby from services you love and generate real-time reports in just a click. You can also select which key performance indicators you want to focus on and bring filtered data to your stack or tables.
2. Enhanced productivity: When real-time reports can be accessed by the whole team, the managers can easily identify what is causing delays or what needs to be improved. It will also make your employees accountable for their performance. No need to depend on monthly or quarterly reports and analyze what’s going wrong. It’s all about putting things in context.
3. Strategic decision-making: Reports are needed to take important business decisions. For example, if you are about to launch a new product, you need a product-market fit report. Similarly, you need a marketing report to analyze how your marketing campaigns are doing. With a report based on current data, you will likely make better decisions.
4. Optimize business goals: Real-time reports can help you identify customer patterns, the latest market trends, and growth opportunities. This will help you reach your business goals faster. You may also alter your business goals accordingly and react to obstacles before they even appear.
5. Share reports directly with clients: Now, you do not need any special person to convey your performance results to your clients or stakeholders. You can easily share real-time reports with them and make them a part of your business journey. This also enhances the transparency between you and your clients and/or stakeholders.
Static reports are important but real-time reports have their own amazing benefits in this fast-paced, constantly changing marketplace. Now, let us see how you can use API connectors in Stackby and generate real-time reports in just a few clicks.
How to automatically pull data using API connectors for real-time reporting?
Before we begin, here are a few things that you must know. Stackby provides more than 25+ column types that help in structuring data properly. One of the column types is API that enables Stackby users to connect their Stack with third-party apps like:
Let us now see the steps you need to take to connect your Stack with third-party apps and pull data automatically for real-time reporting.
Step 1: Integration
In the first step, you need to integrate your Stackby Workspace with a third-party app that you need to use for real-time reporting.
- Go to your Stackby Workspace and click on Connect to an API.
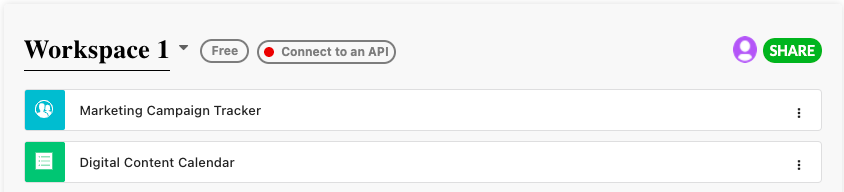
Connect Stackby Workspace with an API
- Select an application from the list of integrations.
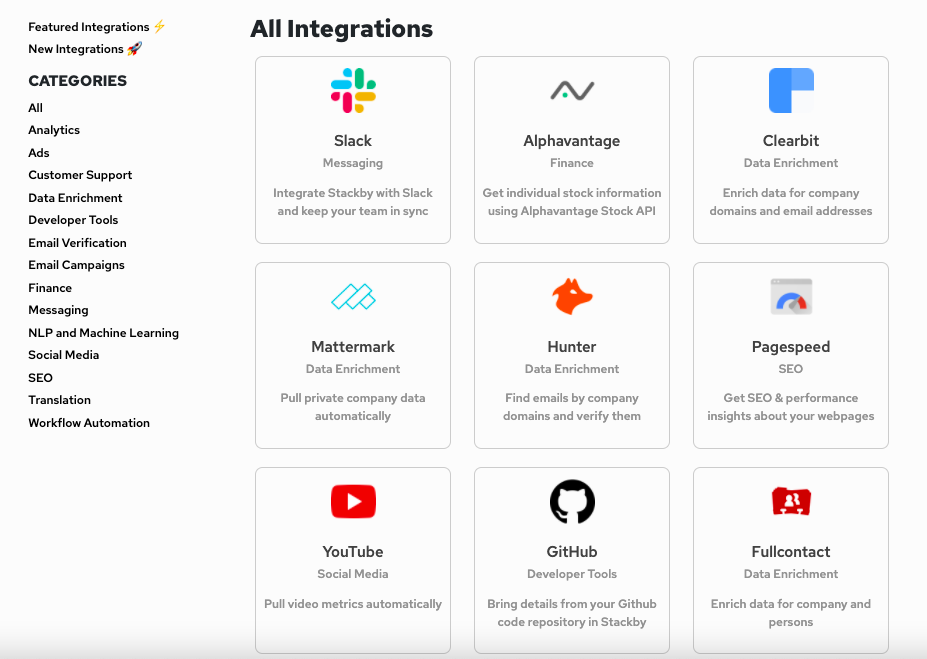
- Click on the Integrate button given in the top-right corner of the screen.

- Add your API key and other necessary information required and click Save.
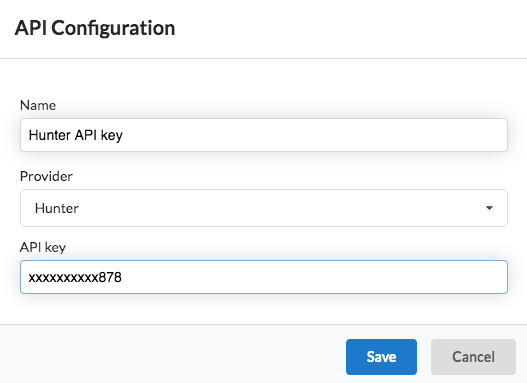
Success! You have now added the integration to your Stackby Workspace. You can now use the API connector column in your Stack and use this integration. Let’s see how in the next step.
Step 2: Connect Column to API
To connect your Stack with a third-party API and pull data from that app follow these steps:
- Go to your Stack and create a new column of type API.
- Configure third-party APIs to pull data.
- Select a particular service from the API service provider.
- Select a reference column and click apply.
You have now successfully created a pathway to bring data from a third-party app to your Stack. Let us see how to fetch data and store it in your Stack in the next step.
Step 3 Fetch data using JSON Data Explorer
Stackby provides a JSON (JavaScript Object Notation) data explorer that is used to store and exchange data between a browser and a server. This JSON data explorer brings in the complete data from the API request and lets you configure that data as per your choice. Let us see how to use this data explorer for automatic report generation.
- Click on {data} in the cell of API column type and the data explorer will open.
- Select which data you want to configure in your columns.
- Click on create columns.
- You will see that the data you selected is placed as separate columns in your table.

This way, you can bring data from a third-party app to your stack and use it for generating reports. But how to bring data in real-time. Let’s find that out in the next step.
Step 4: Generate real-time reports automatically
Now, your manual work is done. It is time to refresh data in real-time and generate reports. Here’s how:
Refresh Data on Individual Row: To refresh data at any time, you just need to click on the refresh icon given on a cell.
Refresh Data on Multiple Rows: You can also refresh multiple cells together and update their data in real-time. Just select the cells, right-click and then click on refresh data.
Time-triggered Automation: Why take the hassle of refreshing data manually when with Stackby you can automate real-time data fetch. To do that just follow these quick steps:
- Click on the clock icon given along with the name of the API column.
- Click on Create Automation on the pop-up.
- Set the day and time of the automation. For instance, every 2 days at noon.
- Click schedule and the data will be refreshed as per automation.
This way, you can check the real-time report on your Stack and utilize it in decision-making.
Step 5: Visualization
Stackby allows you to organize and visualize your data in multiple ways. This makes it easier for you and your team members to understand the real-time reports that you generate on Stackby. Here are some easy ways to visualize your reports:
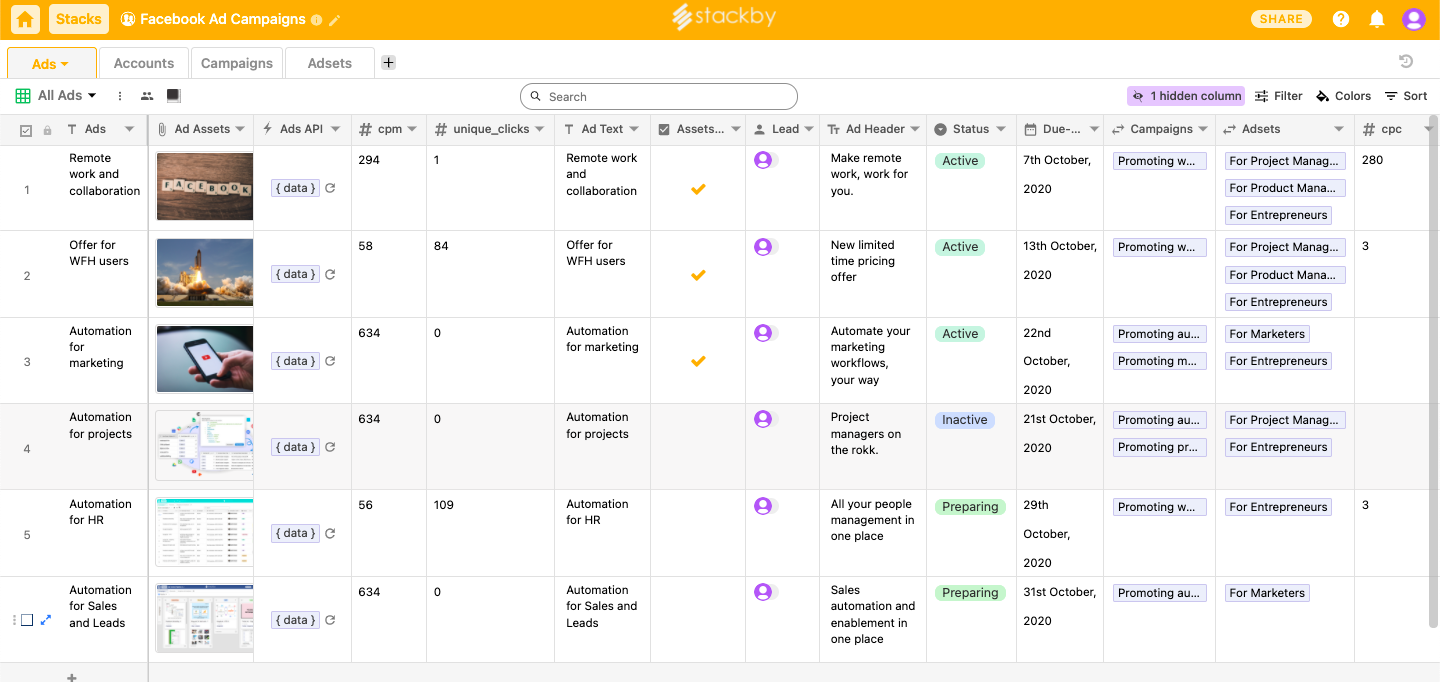
- Grid View: If you want to view your real-time report in the form of a table, you can choose the Grid view. You can use search, set filters, or sort data as per your requirements.
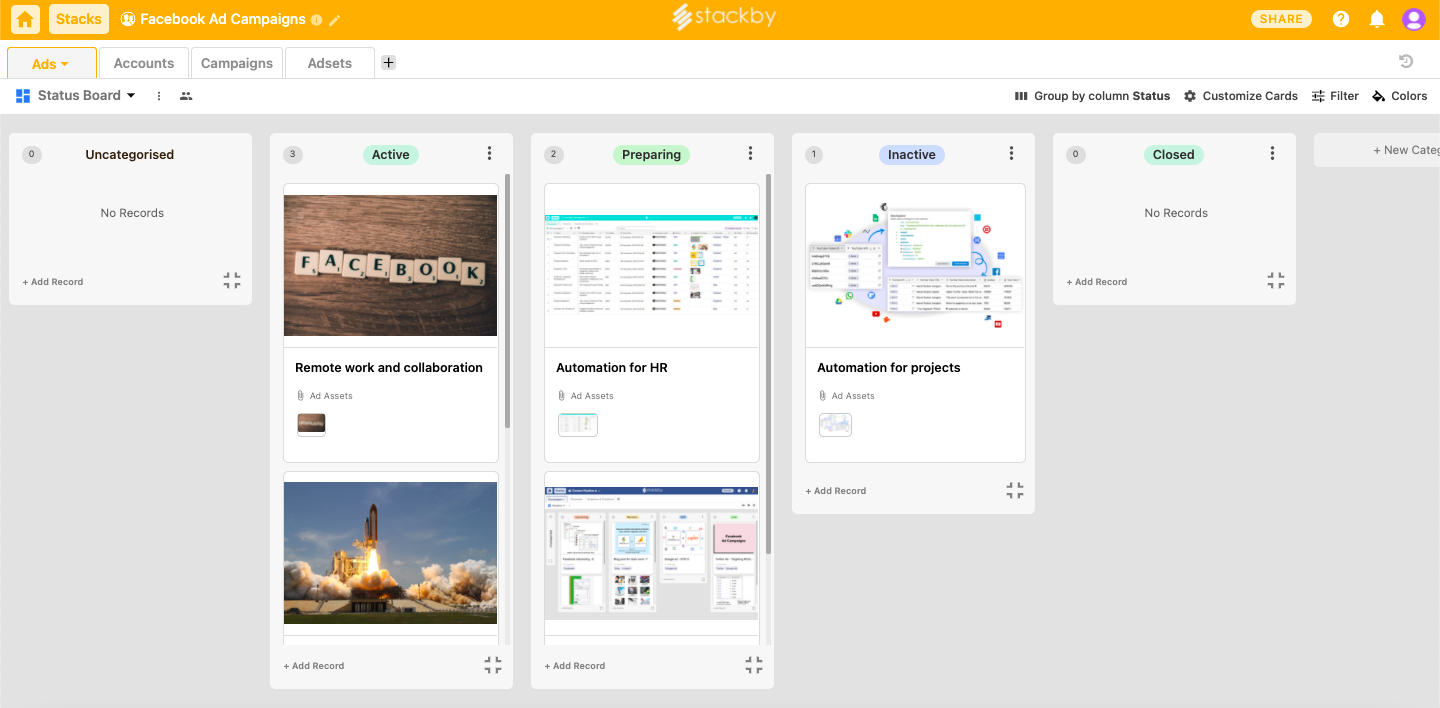
2. Kanban View: Stackby also allows you to visualize your real-time reports in the form of cards that depict the various stages of your project or workflows.
3. Gallery View: This view enables you to create effective real-time reports that are easy to understand. You can select different elements or assets from the report that you want to show on the cards.

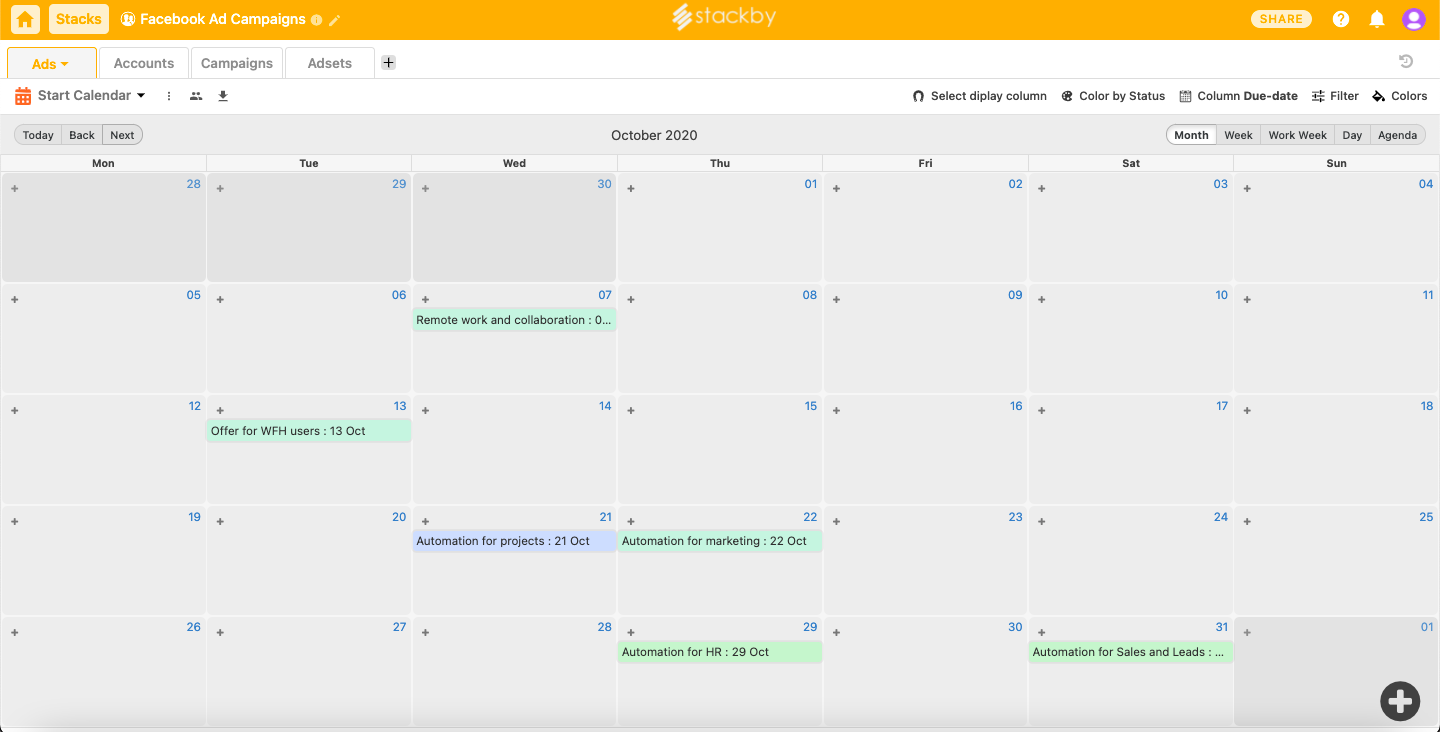
4. Calendar View: If you are following crucial deadlines, Stackby offers a Calendar view to sort things out and maintain a steady pace. You can easily view data on a daily, weekly, or monthly, or Work Week or Agenda basis.
Use-cases for real-time reporting in Stackby
- Real-time SEO Reporting
Every business uses an SEO strategy to optimize the content of the website, reach the target audience, and enhance its rank on the search engines. With effective SEO reporting businesses can ensure:
- More organic traffic is being generated
- Enhanced visibility of the website
- Better conversions
- Content created is as per the user’s requirements
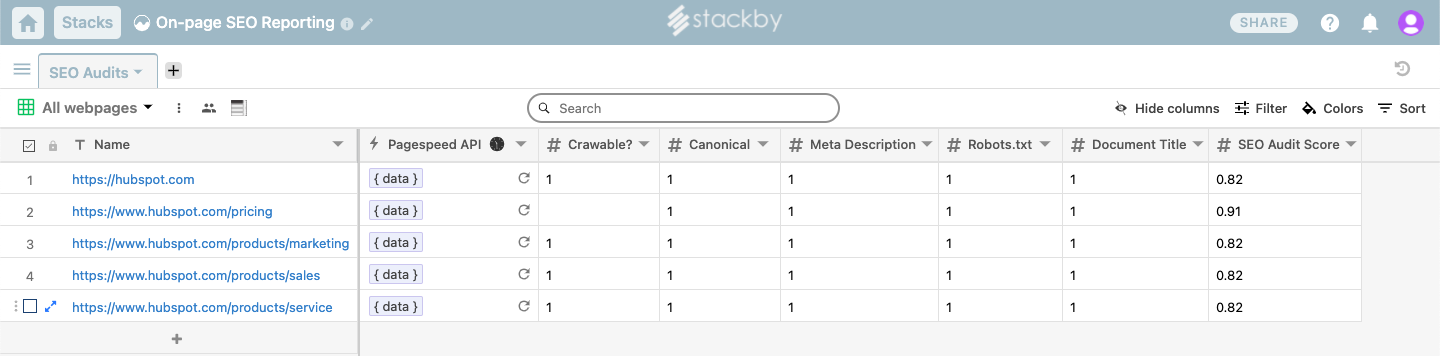
With Stackby, you can integrate tools like Pagespeed, SerpStat, Moz, Ahrefs, Alexa, and SEMRush to gain powerful insights about your website and enhance your search engine optimization accordingly. Given below is our real-time SEO reporting template that includes Google PageSpeed API integration so that you can keep a track of every page of your website for SEO, record SEO audit score, monitor crawlable and canonical aspects of your website, and more.
Here’s a step-by-step video on how to create an SEO Audit Report for your website using Stackby.
- Real-time Google Analytics Reporting
Google Analytics is one of the most commonly used tools to monitor, track, and analyze websites, blogs, and social networks. With Google analytics you can:
- Gain insights about important metrics like page views, pages per visit, bounce rate, average time on site, and new visits.
- Track the conversion rates and analyze the effectiveness of your marketing campaigns.
- Understand which strategies are bringing maximum returns.
- Find the most commonly used keywords on your website and more.
Stackby provides a real-time Google Analytics Reporting template integrated with Google Analytics API to help you report the number of new users, session per user, and the percentage of new sessions for a particular period. You can also get a monthly overview of all the relevant metrics data generated by Google Analytics and build your custom Google Analytics Dashboard.

Here’s a detailed, stepwise video on how to create a custom Google Analytics Dashboard for your business using Stackby.
- Real-time Marketing Campaign Reporting
An effectively planned marketing campaign can change the face of your business in no time. It aims to reach your customers in a variety of ways such as email, advertising, pay-per-click, or social media. A well-planned, eye-catching marketing campaign can help you work on your various business goals like:
- Attracting new customers,
- Increasing your sales,
- Advertising a new offer,
- Improving brand loyalty, and more.
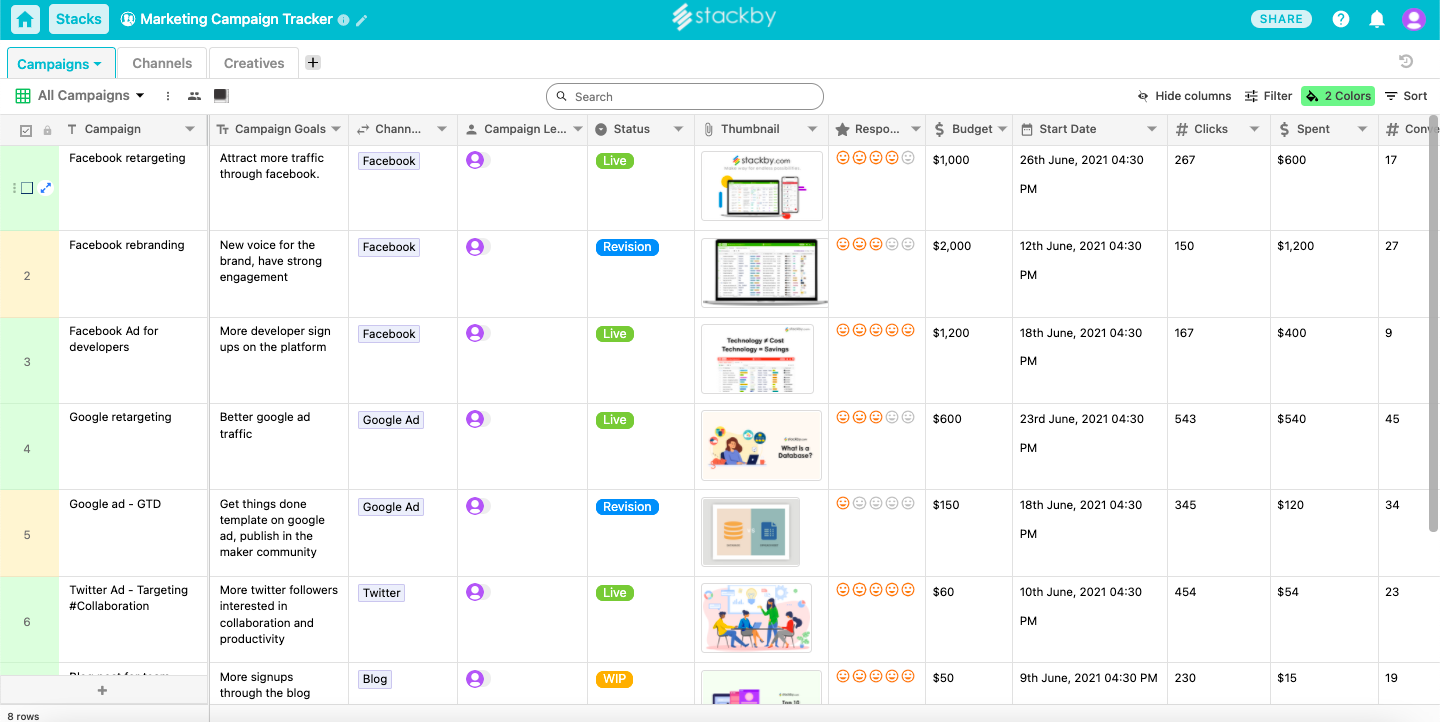
Stackby provides a Marketing Campaign Tracker template that you can use for real-time marketing campaign reporting. With this tracker, you can report the status of your marketing campaigns, check the amount spent on each campaign, keep track of the conversion rates, and monitor and update your campaign management plan as and when required.
The following video shares the complete process of how to build an automated marketing KPI tracker for your website.
- Real-time Video Analytics Reporting
Video content is the essence of every business's marketing strategy today. More than 87% of online businesses are using video marketing as a tool. Videos are widely accessible, they add value to your business and convincingly communicate your story. But, creating videos is not enough. You must have a tool to monitor and generate automatic reports for analyzing the performances of your video.
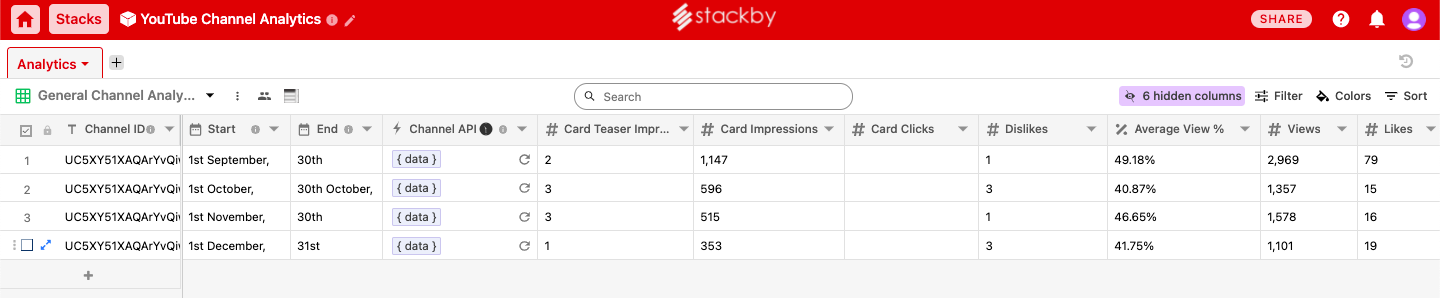
Stackby provides YouTube Channel Analytics Template that helps you refine your video content strategy. With this template, you can track the performance of all your YouTube channels in one place. It is integrated with YouTube Analytics API so that you can import the required video analytics data directly into your tables such as the number of views, likes, dislikes, comments, and the average view percentage. You can also use YouTube API to bring and track your video and channel details. For instance, video title, video description, tags, likes, views, dislikes, channel title, channel description, total views, total subscribers, and more.
Here’s a detailed video on how to create a custom YouTube Channel Reporting tool with Stackby.
Start real-time reporting with Stackby today!
Take your business a step ahead of your competitors by using real-time reports for decision-making. Stackby lets you connect with different third-party applications in just one click so that you can bring all the required data in one place. You can not only generate reports automatically but also visualize them in different formats at your convenience. So, wait no more and sign up with Stackby for free and start using our real-time reporting use cases or use an API connector to create your own real-time reporting tool.
![A Simple Guide on Workflow Management Software [Updated 2024]](/blog/content/images/size/w960/2021/12/work-management-blog.png)